
By David Tod Geaslin
When we attempt to force maintenance spending into specific lumps of time that do not meet the needs of our machines, we create the need to defer maintenance. Maintenance budgets fail because final budgeting authorities do not understand the disastrous consequences of deferring maintenance.
In 2001, I was asked to create a 16-week college course in the management of maintenance. During the creation, I made four significant new discoveries concerning the financial management of maintenance and created rules to cover them.
- The “Inverse-Square Rule for Deferred Maintenance”
- The “Effects of The Chaos Theory on Budgeting Maintenance” Rule
- The “Cost to Improve Maintenance” Rule
- “The Necessity for a Corporate Memory for Maintenance” Rule
These rules explain (1) why maintenance budgets fail to perform, (2) the trigger that initiates failure, (3) a self-financing solution to improve maintenance without having to inject cash to improve the quality and quantity of maintenance, and (4) what has to be done to sustain proper maintenance funding.
In this article, I will discuss the first rule. In my quest to quantify the relationship between pre-breakdown and post-breakdown maintenance expenses I made a discovery that can create a paradigm shift in how we manage maintenance. We all know the longer we operate a machine that needs repair, the more it will cost to fix it. The people I know that are in upper management that have not been directly involved in maintenance know it will cost more, but think that the worst-case penalty for deferring maintenance might be up to twice as much.
Those of us who have had many years of direct experience in managing maintenance have tried to tell them that the penalty is significantly more than that. I personally felt that the cost of deferring maintenance was three to four times as much as a timely repair. What I discovered in my research is that the penalty for deferring maintenance is not more, not twice as much, not four times as much, but that the real penalty for deferring maintenance that becomes a breakdown event is 15:1 minimum and often exceeds 40:1!
 This shocker came to me was when I attempted to find a metric that would explain the before and after breakdown cost difference. I had to go to an exponential factor! Arithmetic and geometric progressions could not consistently produce the dramatic cost differences. When I realized that the cost penalty was exponential I was able to find the base number. I created a rule that I call Geaslin’s “Inverse-Square Rule for Deferred Maintenance”. This rule states:
This is why a $40 brake shoe left in service until the brake shoe rivets damage the brake drum, the drum ruins the core value of the shoes, the truck breaks down on the road, a second truck and driver has to be dispatched, the load transferred, and one driver dead-head back with the tow truck results in an expense of the square of $40 ($40X$40=$1,600) and becomes $1,600. If the brake problem causes a personal injury accident the cost can easily square again to $2.5 million.
This rule explains how a leaking $50 toilet valve, if left in service until it overflows can easily cost the square of $50 to create a total flood damage cost of $2,500 in carpet, pad, electrical, and document destruction.
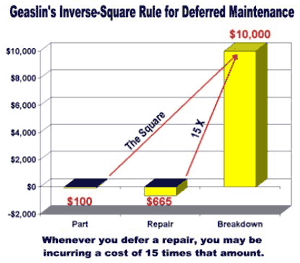
This is why a failing industrial electric motor bearing valued at $100 can create a $10,000 repair if left in service until failure and the rotor wipes out the windings and damages the stator.
This rule explains how deferring a $1,000 cleaning of a heat exchanger can easily create a $1,000,000 expense in corrupted product, re-refining, packaging, and shipping costs.
My students were not quick to accept that the penalty could be the square of the failed part.
Then we computed the total invoice cost for parts and labor to have repaired the primary failure part at the earliest moment discovered and divided it into the total stinky maintenance event cost. This ratio turned out to be a minimum of 15:1 and often exceeded 40:1.
At this point I began to understand why final budgeting authorities have always seemed willing to take the breakdown risks associated with deferring maintenance. Their Risk / Reward Ratio Analysis computations have been based on taking their Maintenance Manager’s worst-case scenario of about 4:1, discounting it to a ratio of about 2:1, and then basing their budgeting decisions on that risk factor. My new discoveries show that the real Risk / Reward Ratio is between 15:1 and 40:1 and the consequences of betting that a breakdown will not occur are much more disastrous than ever thought. No one would ever take those odds at a craps table.
When I explain this rule to Maintenance Managers, they embrace the analysis immediately because it explains what they see in the field everyday.
When I explain this rule to Executive and Budget Managers, they recognize it as a metric they can use to create a new matrix for budgeting and managing maintenance to a lower cost value. The application of this new rule creates one of the few Win/Win situations between the Maintenance Department and final budgeting authorities that gives each what they need to succeed.
The application of this rule can be as important to managing maintenance as The Deming Method is to quality control. The application to maintenance budgeting is that powerful. If you wish to test this rule, pull that big maintenance invoice out of your inbox, add in the maintenance, operational, and customer collateral expenses, take the square-root of the total, and see if that is the price of the primary failure part. Discuss the results with your staff. If you see the relationship, it can offer a better way to manage maintenance budgets.
If you would care to know more about this rule and my other discoveries, more detail is available on my web site at www.ManagingMaintenance.com.
The author:
David Geaslin is a graduate of The University of Texas at Austin with a degree in Industrial Management & Marketing (1966); a former Marine Corps Aviator and Aircraft Maintenance Officer (1968-1975); the CEO of his maintenance service company for 15 years (1975-1990); and has consulted offering coaching and seminars in the management of maintenance since 1990. He lives in Gonzales, TX and travels offering his services wherever needed. In addition to consulting services, he is the course content creator and instructor for Texas A&M University’s Texas Engineering Extension Service (TEEX) Managing Maintenance Program.
